The measured values are continuously written to the unit's internal data carrier with every modification. The stored measurement values (set value, Main line rate, Return line, external and flow rate) can be viewed directly on the screen as a trend graph. For detailed fault diagnosis, all stored measurement values can be subsequently saved on a USB data carrier.
Trend chart
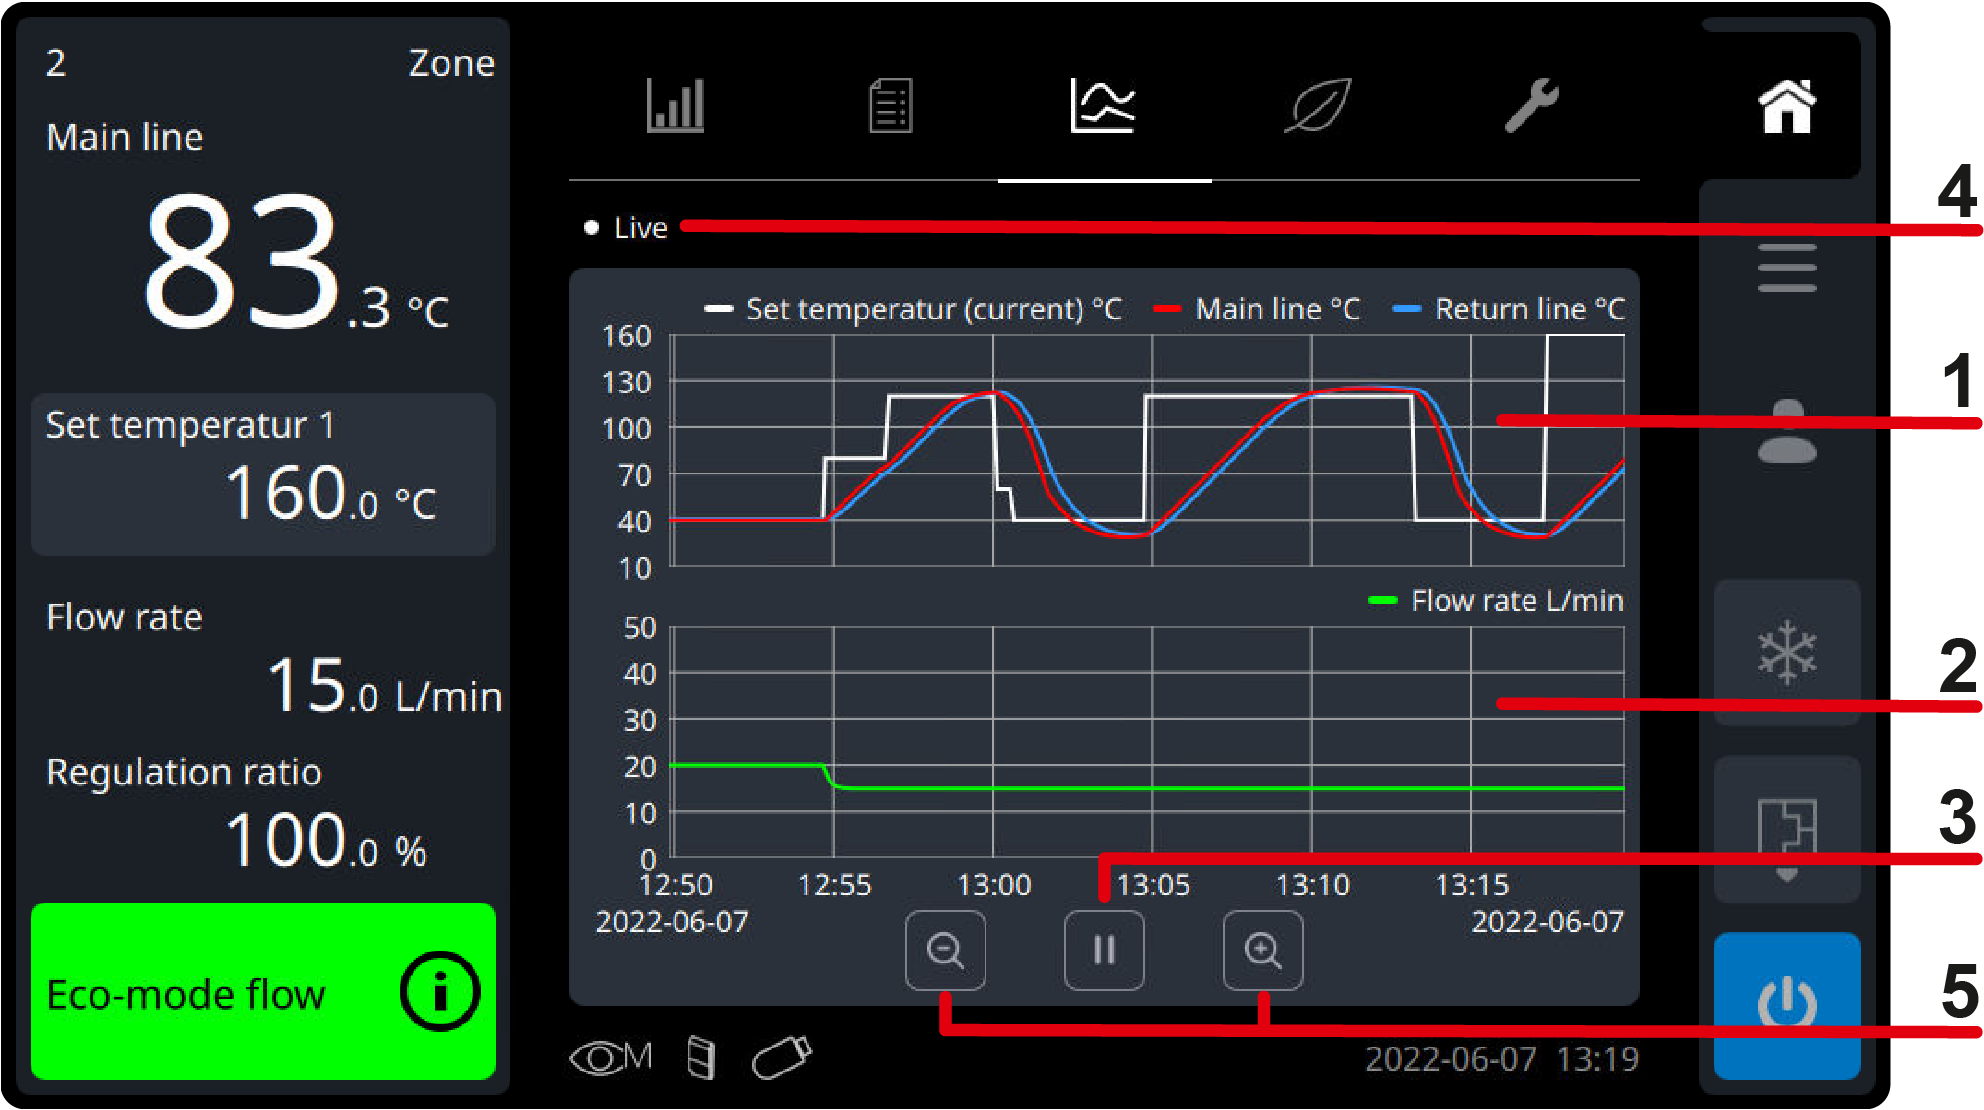
On the basic screen under the register symbol (), the recording of the predefined measurement values for temperature and flow rate is shown as a trend graph.
Temperature measurement graph ①
[Set Value] (current)
[Main line]
[Return line]
[External] (if available)
Flow rate measurement graph ②
[Flow Rate]
Play/pause ③
Press pause () to pause live mode. → The trend chart can be viewed without continuous modification → The trend chart can be moved on the time axis by swiping left and right → The time axis can be enlarged and reduced
Press the play button () to resume live mode. → The time axis automatically returns to the real-time trend chart → The time axis can be enlarged and reduced
status of the unit ④
Live:
Live mode is active
Hold:
Live mode is paused
Zoom-time axis button () ⑤
Shorter time range with a minimum interval of 1 min/div
Zoom-time axis button () ⑥
Longer time range with a maximum interval of 80 min/div
Back up the data
NOTE!
USB data carriers formatted with FAT, FAT32, exFAT and ext2/3/4 are supported.
If saving to the USB drive is not possible, a corresponding warning is displayed.
Note that the export process can take up to 30 minutes, depending on the selected time period (2 weeks).
For each unit, a separate directory is automatically created on the USB data carrier, into which the recording files are written.
Set the parameter to the desired value. → The data for the current day is saved, including the selected previous period (days, weeks).
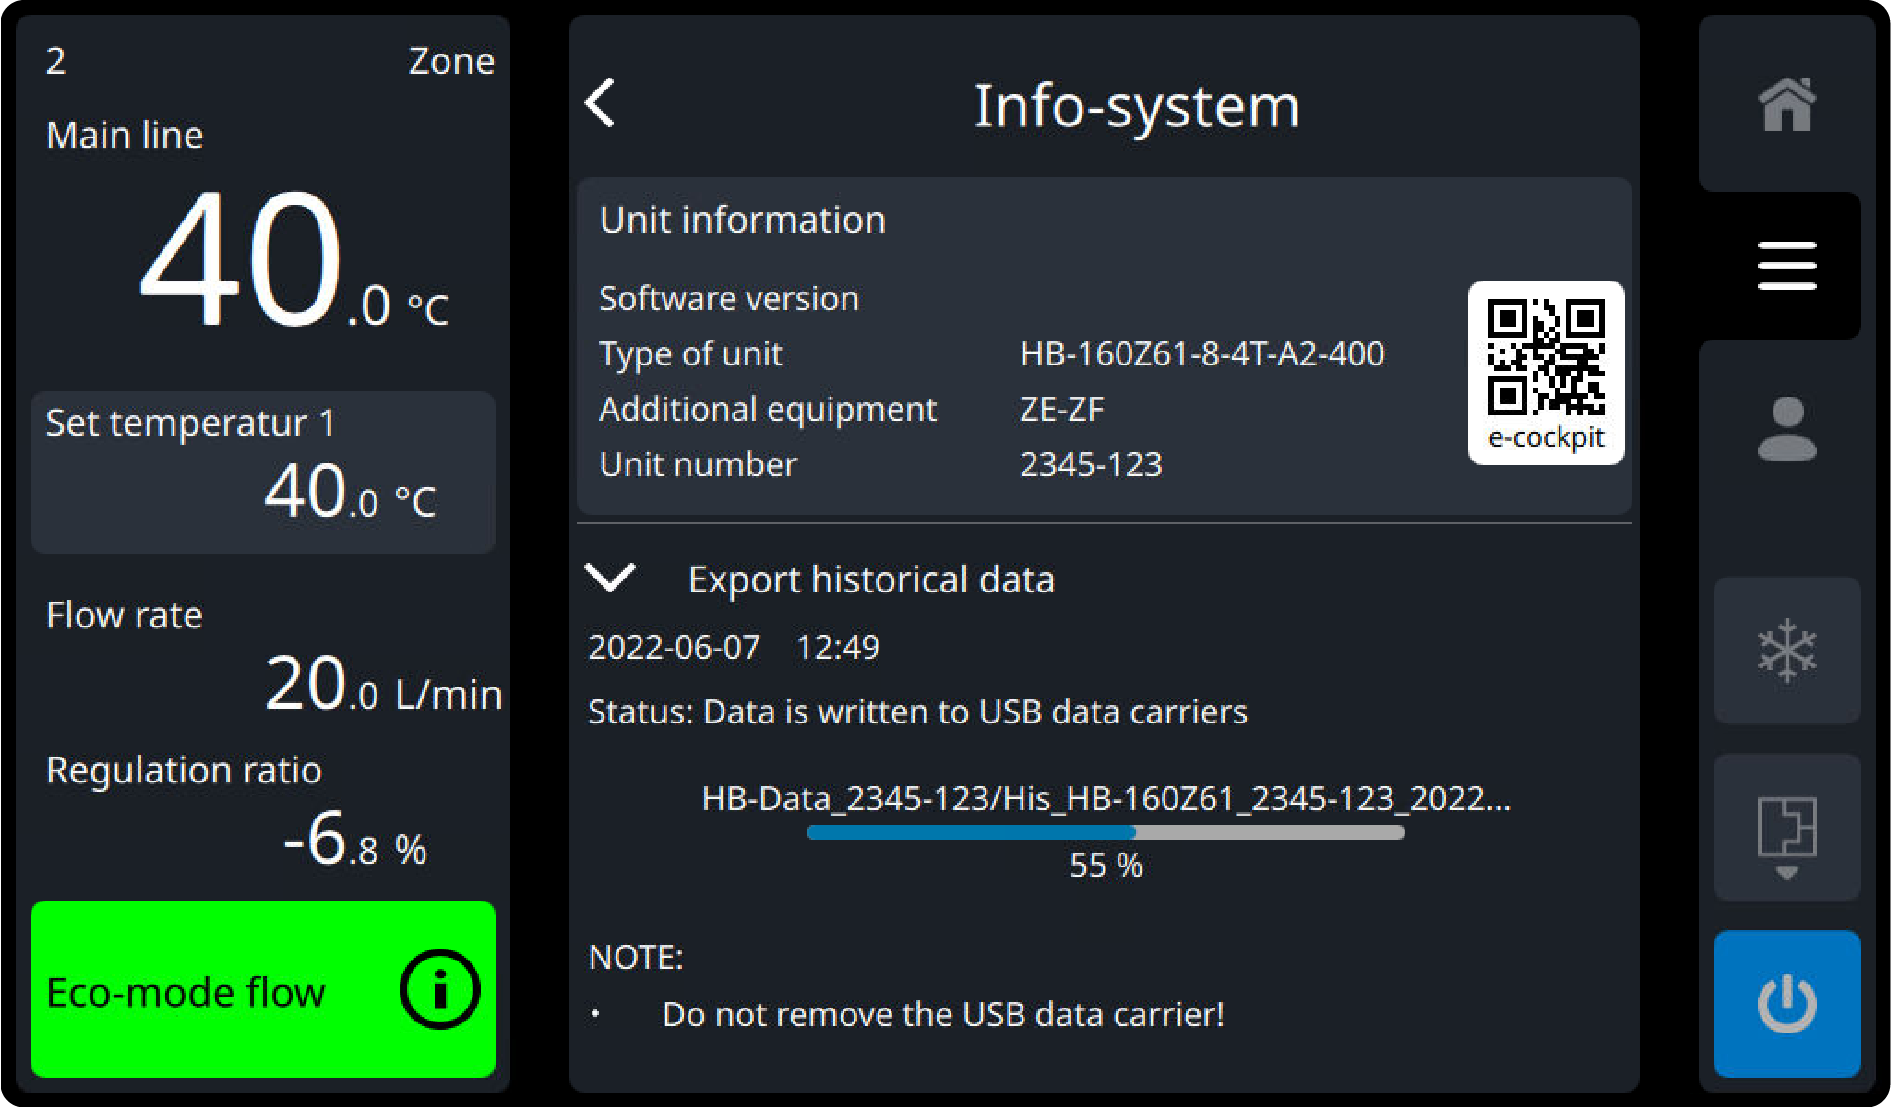
Tap the disk icon () on the [Export Historical Data] parameter to start the process. → The data is written to the USB data carrier as a ZIP file. The information system is opened automatically and the current progress is displayed (→ Fig.). In addition, the process is shown on the basic screen with the data carrier symbol flashing yellow (). → When data transmission act complete, this is notified to the user and shown by the white symbol of the data carrier ().
Remove the USB drive.
Name of data
The file names on the USB drive are created automatically according to the following examples.
To visualize and treatment the recorded data, the software VIP(visualisation program) can be downloaded from https://knowledge.hb-therm.eu.
Datenschutz - Data protection - Protection de données
Wir setzen Cookies ein, um Ihnen die Nutzung unserer Webseite zu erleichtern. Weitere Informationen zu Cookies finden Sie in unserer Datenschutzerklärung. We use cookies to help you use our website. More information about cookies can be found in our privacy policy. Notre site utilise des cookies afin de vous garantir un service optimal. En utilisant ce site web, vous acceptez les présentes conditions. Vous trouverez privacy policy de plus amples informations. Privacy Policy