Download PDF
Download page Thermo-6 display.
Thermo-6 display
The temperature control unit is operated via the touch screen using interactions such as tapping, swiping and scrolling. For easy navigation, the user interface is divided into two fixed areas:
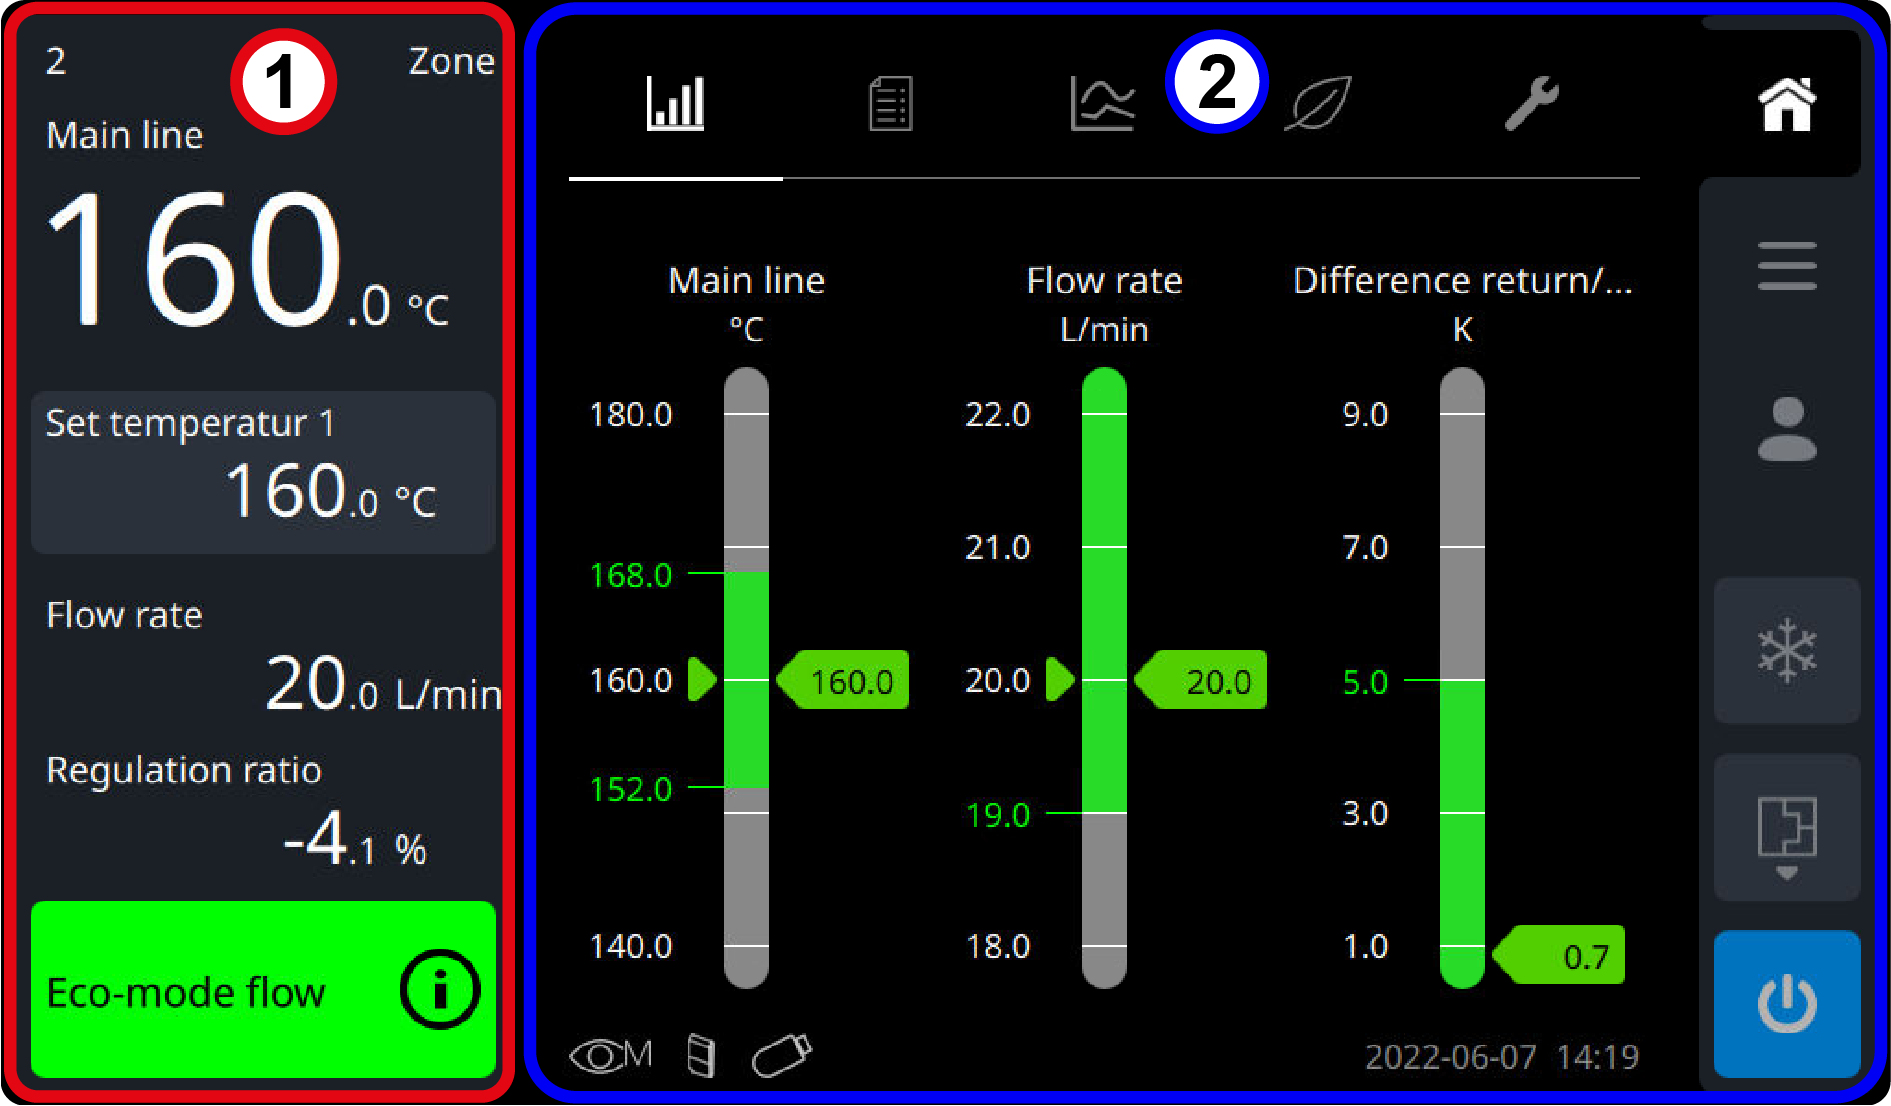
- Gerätestatus(1)
- Basic screen (2)
ATTENTION!
Never touch the screen with hard or sharp-edged objects.NOTE!
- If you press the button for a function or parameter for 2 seconds, the help system opens directly. The information that matches the parameter is displayed.
- The parameter and settings that cannot be operated or changed are shown in grey.
Symbols
| Display icons | |
|---|---|
| The symbols at the bottom of the main screen display information about the unit. | |
| Limit monitoring disabled. The unit no monitor limits. |
| Limit monitoring activated. The user manual determines and sets limits. |
| Limit monitoring activated. The unit automatically determines and sets limits in accordance with the set monitoring level. |
| Connected to Interface Server Gate-6 |
| Connected to the Internet |
| Remote control activated |
| Timer activated |
| USB data carrier connected and recognized |
| Data transfer USB data carrier active (e.g. During a software update) |
| Controller optimization activated. The control parameter are automatically recalculated and set. |
| Lower speed limit activated |
| Upper speed limit activated |
| simulation operation activated |
Control icons | |
| Edit the current basic screen page (favorite selection) |
| Favorite selection for actual value display |
| Setting selection The setting is immediately applied and returns to the previous screen. |
| Switch to the next user interface. |
| Return to the previous user interface. When values are entered or selected options, the corresponding input window is left without modification. | |
| Show or hide expanded dialog |
| Switch on or off the function |
| |
| Tapping on the button makes the input visible or hidden. |
| Start the coupling the e-cockpit process |
| Stop starting the process (e.g. Controller optimization, recalculate detect) |
| Stop the process (e.g. Controller optimization, recalculate limit detect) |
| Start the process (e.g. Software update package is downloaded and installed) |
| Exporting data |
| Importing data |
| Reset settings |
| Trend graph zoom keys | |
| Play live mode of the trend graph |
| Stop live trend graph mode |
| Accepting |
| Cancel |
| Keyboard symbols | |
| When setting the value of parameters, a numeric or letter keyboard is automatically displayed. | |
| Delete previous character |
| Enter key Back to previous screen with value transfer |
| Switch between input fields |
| |
| Change sign |
| Increase or decrease value input by a tenth (0.1) |
| |
Unit status

| Designation | Display | Setting |
|---|---|---|
| Description field (1) | Unit naming | The unit naming can be edited by tapping the button.
|
| Address field (2) | Remote control address | The remote control address can be set by tapping the button.
|
| Measuring point (3) | Shows the current actual value for temperature control, depending on the setting.
|
|
| Set value (4) | Shows the corresponding set value depending on the operating mode.
| The set value can be set by tapping the button.
|
| Flow rate (5) | Measured flow rate | - |
| Regulation ratio (6) | Heating capacity or cooling capacity in% | - |
| Status field (7) | Shows the active operating mode with color status indication: | Tapping on the status field (symbol If the operating mode text blinks in the status field, it is indicated that the selected operating mode is still in preparation.
|
| ||
 Trouble-free (green) Trouble-free (green) | ||
| ||
 Warning (yellow) Warning (yellow) | ||
|


Basic screen

Navigation keys | |
|---|---|
| Home display (1) Quick access to the following basic displays
You can switch between the individual basic displays by tapping on the register symbols or swiping. |
| Main menu (2) Quick access to the main menu, where the submenus are listed in tile form. You can switch between several main menu pages by swiping. |
| Profile (3) Quick access to profile settings, including control language, access rights, horn volume, and screen brightness. |
Function keys | |
NOTE! The function button (cooling, mould evacuation and I/O) must be pressed for approx. ¼ s to perform the function. This serves as protection to prevent unwanted release in the event of accidental contact. | |
| cooling (4) By pressing the button, the unit cools down and switches off (→ click here... ) |
| mould evacuation (5) By pressing the button, the unit is emptied and depressurised (→ click here... ) |
| switch on/off (6) By pressing the I/O button, the unit starts in the defined operating mode. The unit shuts off by pressing the I/O button again. |
Register symbol
Symbol/ Display | Description |
|---|---|
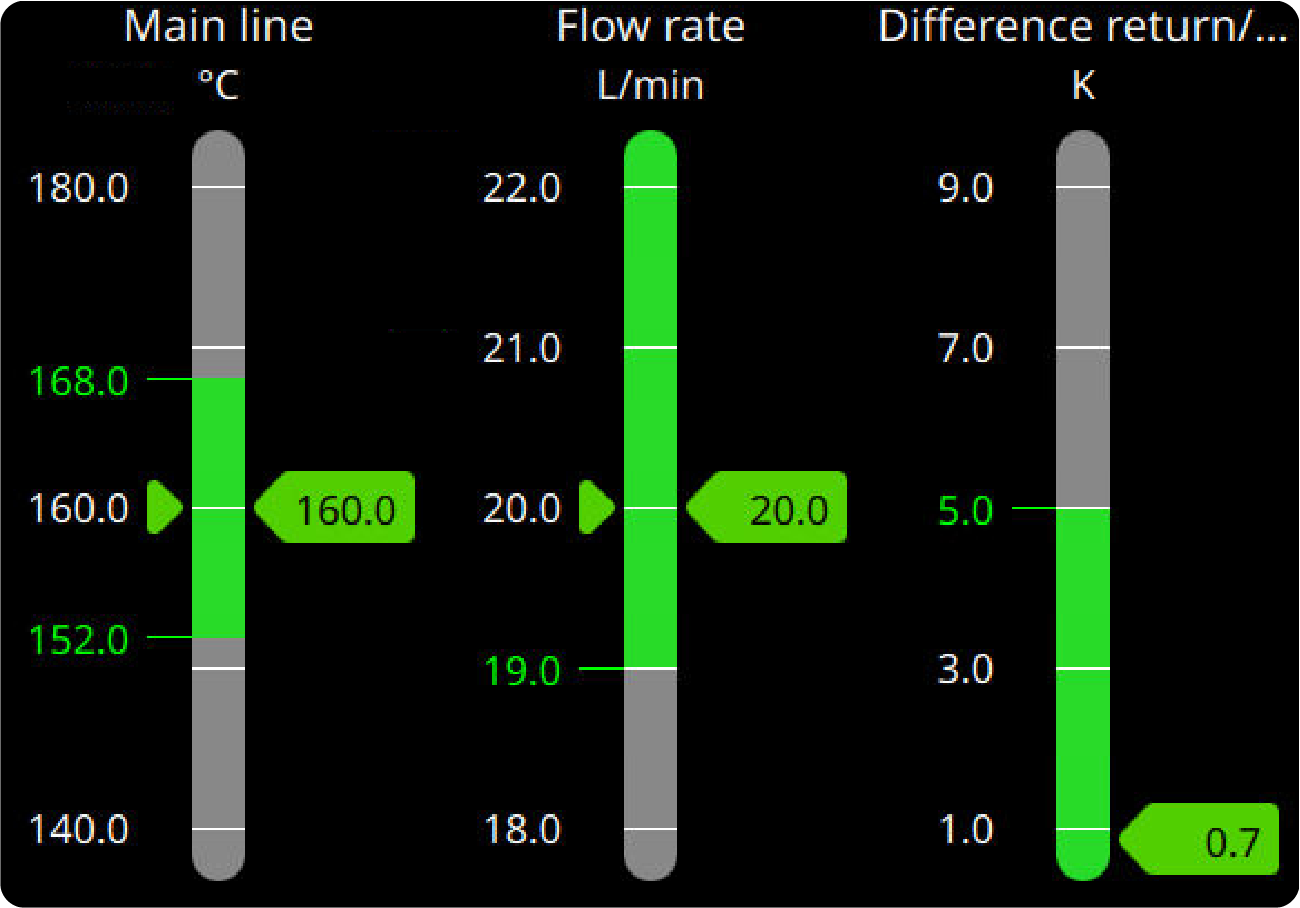
| Actual value display as an indicator graph The actual values of temperature (Main line, Return line or external), flow rate and difference between Main line and Return line are displayed graphically as indicators. In addition, the set limit values and set values are also displayed.
|
| Actual value display in list form The actual values are displayed in the form of a list. The parameter are shown or hidden depending on the user profile set. To set parameter as favourites or to make changes, tap the edit symbol |
| Trend graph of temperature and flow rate The recording of predefined temperature values and flow measurement values is graphically displayed and recorded continuously. The recording can be viewed retroactively on the standard display for fault diagnosis or saved as a USB recording on a USB data carrier (→ click here). |
| energy-efficient display The energy efficiency Display shows the current savings per year. The savings per year depend on the pump speed and the temperature difference between Main line and Return line (→ click here). |
| Maintenance interval display The maintenance-relevant components are displayed graphically. If a maintenance interval reaches 95%, the necessary maintenance is shown by the symbol in the tab bar on the main screen (→ click here). |